Smaller is better for nanotube analysis
In a great example of "less is more," Rice University scientists have developed a powerful method to analyze carbon nanotubes in solution.
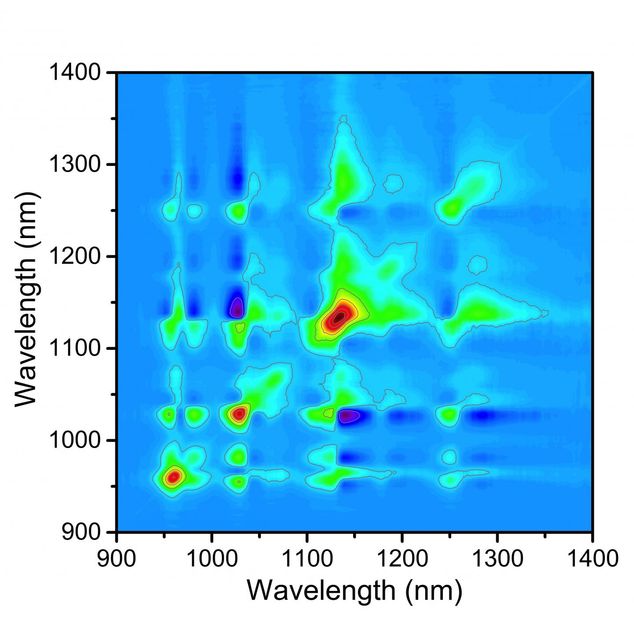
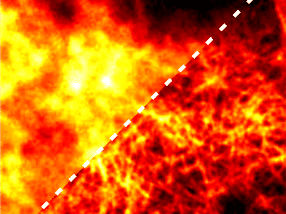
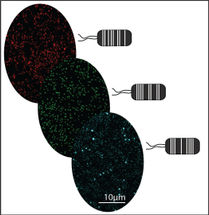
A covariance matrix produced with a new technique at Rice University maps fluorescence signals from various species of single-walled carbon nanotubes that are beginning to aggregate in a sample. The matrix allows researchers to know which types of nanotubes (identified by their fluorescence spectra) have aggregated and in what amounts, in this case after four hours in solution.
Weisman Lab/Rice University
The researchers' variance spectroscopy technique zooms in on small regions in dilute nanotube solutions to take quick spectral snapshots. By analyzing the composition of nanotubes in each snapshot and comparing the similarities and differences over a few thousand snapshots, the researchers gain new information about the types, numbers and properties of the nanoparticles in the solution.
Rice chemist Bruce Weisman, a pioneer in the field of spectroscopy who led the discovery and interpretation of near-infrared fluorescence from semiconducting carbon nanotubes, expects variance spectroscopy to become a valuable tool for researchers who study nanoscale materials.
Carbon nanotubes are hollow cylinders of pure carbon that are typically grown in a furnace. There are dozens of different types of nanotubes and the physical properties and potential uses vary for each type. There is no practical way yet to grow just one type, so they often need to be sorted by physical or chemical means. Weisman said variance spectroscopy could help characterize nanotube samples in the ongoing drive to sort and separate specific types for electronic and optical applications.
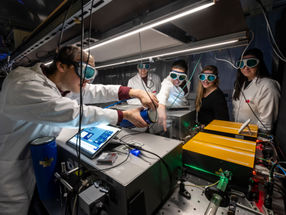
The Weisman lab tested its custom rig on dispersed samples of single-wall carbon nanotubes grown at Rice. The researchers captured fluorescence spectra from a few thousand distinct small regions. Statistical variations among these spectra revealed the numbers of nanotubes of different types and how strongly each type emits light. Further data analysis gave "dissected" spectra of each type, free of interference from others in the mixed sample.
"As we focus our attention on smaller and smaller volumes of the sample, the averaged-out, uniform behavior you see on the macroscopic scale starts to break down, and we see effects from the particulate nature of matter," he said.
"At that point, there are random fluctuations in the numbers of particles within the observed volume. What we're doing is analyzing the resulting random fluctuations in spectra to learn about how many particles of each type are present and whether they're aggregated with each other.
"An analogy might be looking at fans in a football stadium wearing their teams' colors," Weisman said. "If you stand way back and look at the whole crowd, all you can figure out is the overall ratio of Rice fans to Texas fans. But if you zoom in and analyze row by row, you're going to see clusters of Rice fans and clusters of Texas fans and learn how each group aggregates together. That gives you extra insights about the crowd that you could never get from the big view.
"It's similar with nanotubes," he said. "We look at a sample that has a variety of structures and learn more about the properties of individual components. It's a spectroscopic dissection of a complex mixture to get information that would be much more difficult to get with any other method."
Weisman said the technique also helps address nanotubes' annoying tendency to clump together. "When you're trying to use a separation method to sort them out, you can't do it effectively if they're stuck together," Weisman said. "If you want type A and they're stuck to type B, then you're wasting your separation effort. But variance spectroscopy provides a very sensitive way to tell whether particles of different types are actually traveling together."
Weisman expects variance spectroscopy can be extended to analyze many nanoscale materials, like gold nanoparticles and quantum dots, using different spectroscopic probes. "When you make nanomaterials, there is generally some variation in particle sizes that gives a corresponding variation in the spectral properties," he said. "Our variance method can be used with such systems to take a look inside."
Original publication
Other news from the department science


Get the analytics and lab tech industry in your inbox
From now on, don't miss a thing: Our newsletter for analytics and lab technology brings you up to date every Tuesday. The latest industry news, product highlights and innovations - compact and easy to understand in your inbox. Researched by us so you don't have to.
Most read news


More news from our other portals


See the theme worlds for related content
Topic World Spectroscopy
Investigation with spectroscopy gives us unique insights into the composition and structure of materials. From UV-Vis spectroscopy to infrared and Raman spectroscopy to fluorescence and atomic absorption spectroscopy, spectroscopy offers us a wide range of analytical techniques to precisely characterize substances. Immerse yourself in the fascinating world of spectroscopy!